Risk Essentials
The Science On Degradation Risks
Understanding the critical distinction between forest degradation and deforestation is fundamental to accurate risk assessment and investment decision-making.
Core Scientific Concepts
Forest Degradation
A structural change in forest type — e.g., converting primary or naturally regenerating forest into a plantation forest, planted forest, or other wooded land (OWL, 5–10% canopy). It’s not just a temporary drop in canopy from harvesting.*
Key Characteristics:
Defined by conversion between forest types, not by a canopy-loss threshold.
Wood placed on the EU market must be degradation-free after Dec 31, 2020; operators provide geocoordinates and due-diligence evidence.
Harder to see directly; monitoring relies on proxies (connectivity/fragmentation, biomass change, canopy disturbance) and high-res checks.
Common Examples:
Logging in primary forest followed by establishment of an even-aged, single-species plantation.
Converting naturally regenerating forest to OWL (areas >0.5 ha, trees >5 m, 5–10% canopy).
Repeated harvesting that leads to conversion from natural forest to plantation or OWL (conversion may be delayed and must be checked over time).
*EUDR Definition of Forest Degradation. See More at Global Forest Watch
The fundamental difference between degradation and deforestation affects risk assessment, measurement, and mitigation strategies.

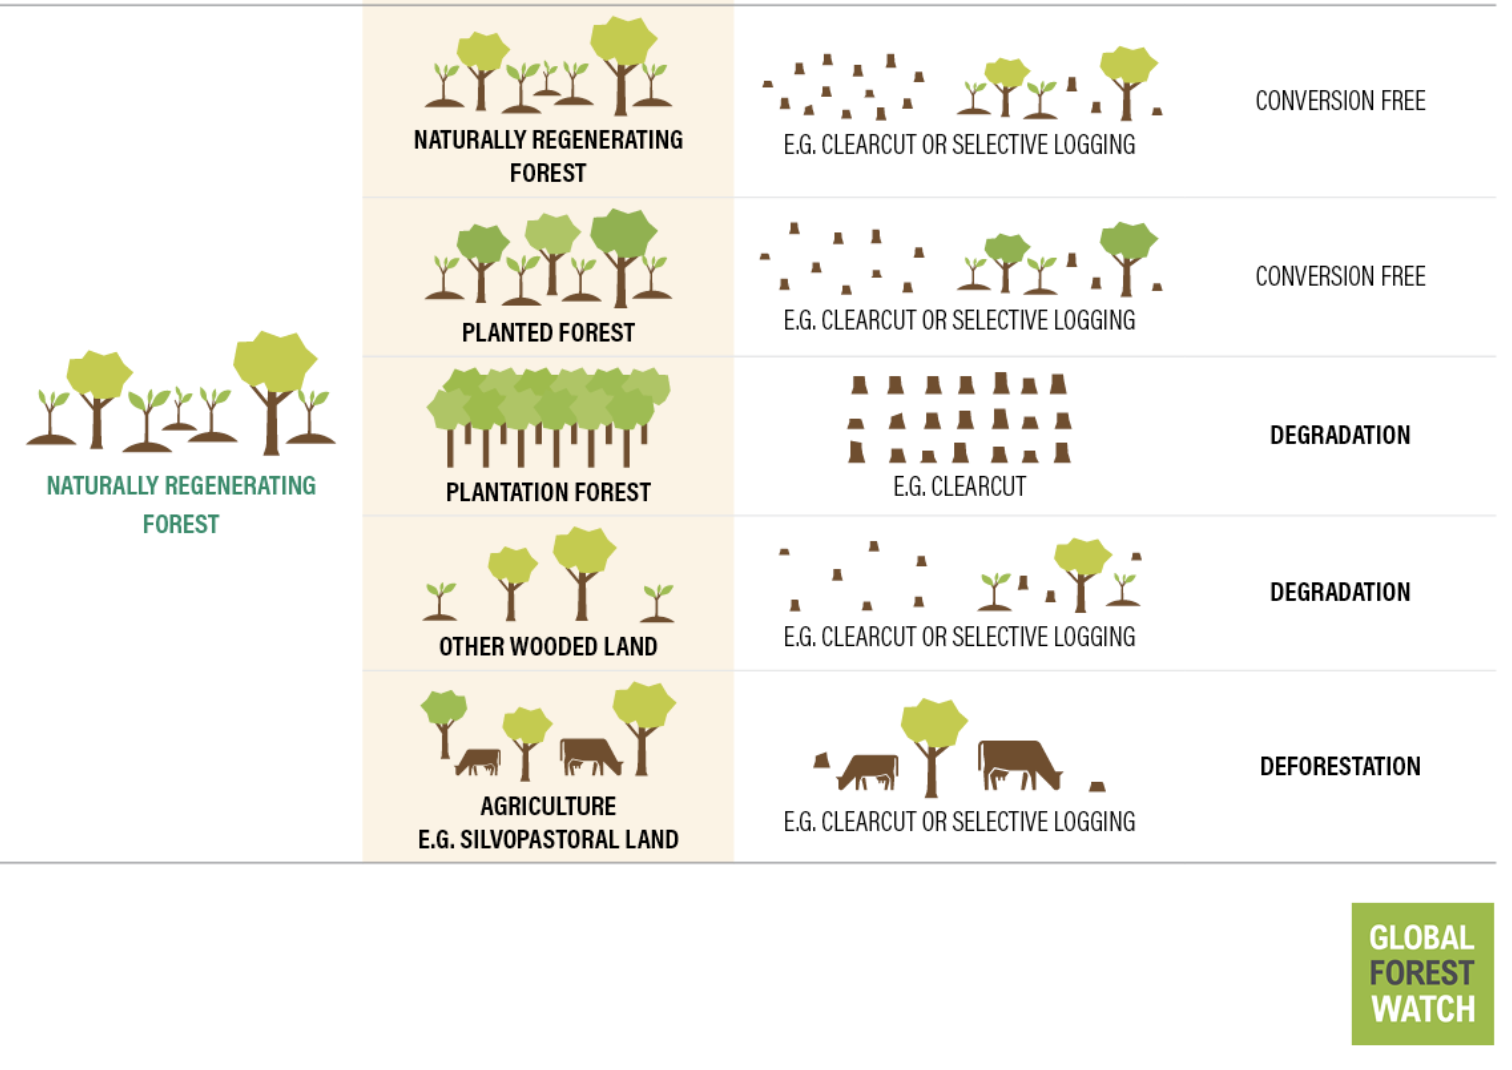
Deforestation
Conversion of forest to non-forest land use (e.g., agriculture, settlements, infrastructure). Under the EUDR, covered products must be deforestation-free after Dec 31, 2020.*
Key Characteristics:
Clear land-use change away from forest (not temporary harvest).
Often easier to detect by satellite than degradation; still requires plot geolocation and due diligence.
Applies to cattle, cocoa, coffee, palm oil, soy, rubber and derived products, plus wood products (wood must also be degradation-free).
Common Examples:
Clearing forest to plant soy, oil palm or pasture.
Converting forest to roads, mines or urban areas.
*EUDR Definition of Deforestation. See More at Global Forest Watch & Environment
See What Science Says About Degradation Risks
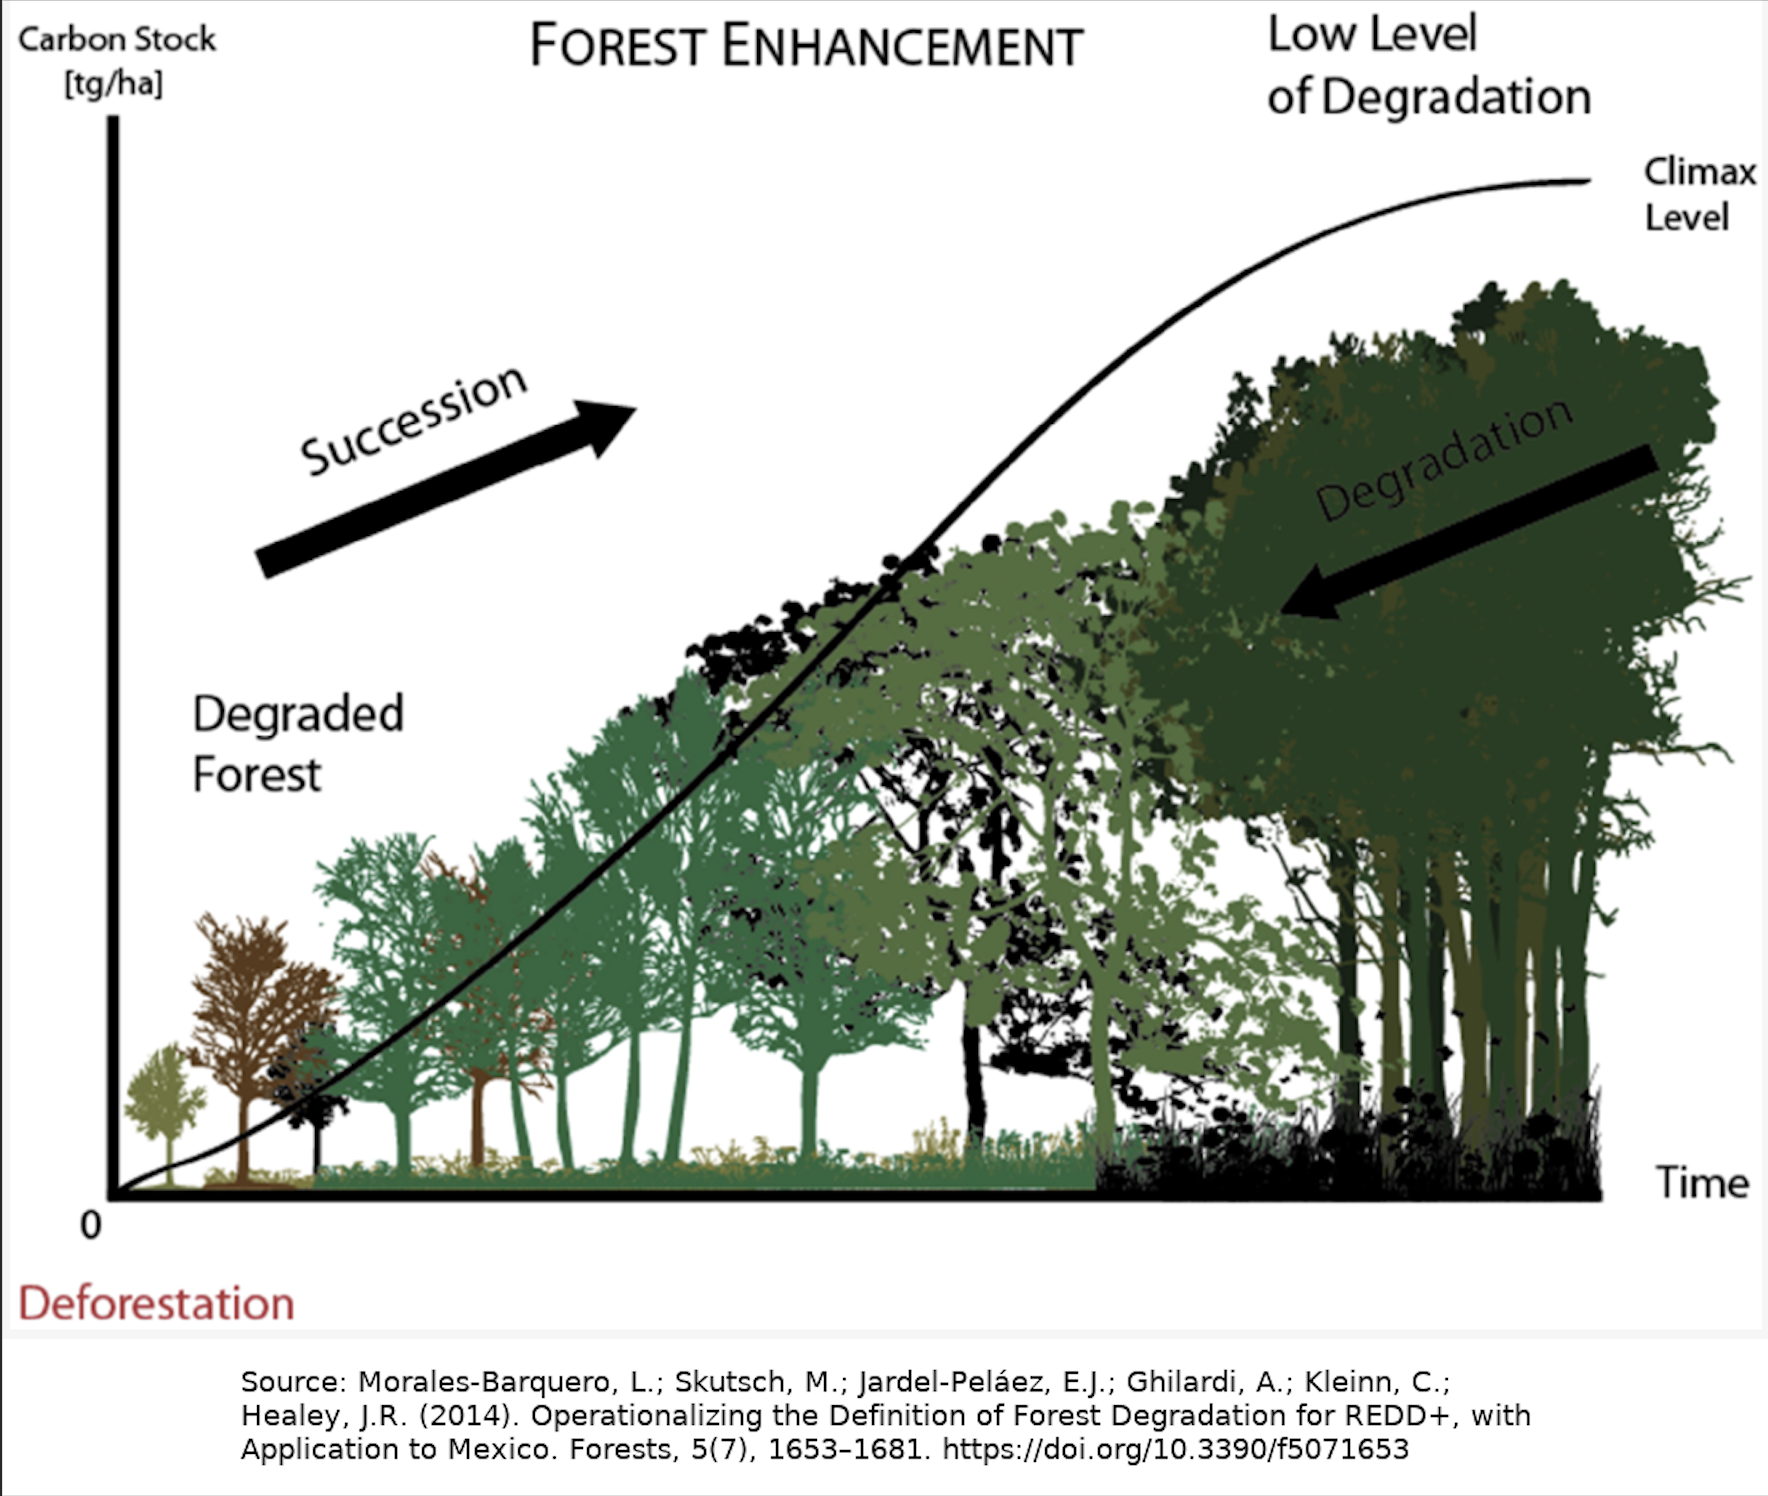
Scientific evidence shows that forest degradation can be widespread, persistent, and financially material even when “forest cover” remains on a map. In several tropical regions, degraded area rivals or exceeds deforested area, and in the Amazon, degradation can generate carbon emissions comparable to deforestation. Because degradation is harder to see, it’s often under-monitored—but not lower risk.
Function & Carbon Impacts
Even where satellite maps still label areas as “forest,” degradation reduces forest functioning—from canopy height and biomass to dry-season evapotranspiration—and can drive substantial carbon emissions. In the Amazon, annual emissions from degradation are comparable to, and sometimes greater than, those from deforestation.
Takeaway: Forests can keep their “cover” but lose value and stability, with real implications for climate, water, and market risk.
Selective logging and fire cause long-lasting declines in canopy structure and biomass.
Carbon losses from degradation/disturbance account for a large share of tropical forest emissions.
Functional declines (water cycling, habitat quality) raise operational and supply-chain risk even without land-use conversion.
The Hidden Scale & Persistence
Degradation affects large areas of tropical forest and can persist for years. In some regions (e.g., the Brazilian Amazon in 2020), mapped degraded area exceeded deforested area for that year. Beyond logged or burned patches, edge effects and fragmentation now touch a significant share of remaining tropical forests, slowly eroding biomass and resilience.
Takeaway: Degradation can be as extensive as deforestation in key hotspots, but it’s less visible and therefore under-managed.
Large portions of tropical moist forests show measurable signs of degradation.
Edge effects (from roads, clearings, fragmentation) reduce canopy height/biomass and spread over time.
Degradation frequently precedes or increases vulnerability to later clearing.


Source: Matricardi, E.A.T., Skole, D.L., Costa, O.B., Pedlowski, M.A., Samek, J.H., & Miguel, E.P. (2020). Long-term forest degradation surpasses deforestation in the Brazilian Amazon. Science, 369(6509), 1378–1382. https://doi.org/10.1126/science.abb3021
Wildfire Risk
Degradation—through intensive logging, dense even-aged plantations, fragmentation, and road building—changes how forests burn. More open canopies and logging slash dry quickly; uniform stands create continuous fuels; and new roads bring human ignitions. These shifts make fires easier to start and more likely to burn severely, especially during drought or heat waves.
Takeaway: Degradation often raises wildfire likelihood and severity, while well-placed fuel management near communities can reduce risk.
Open canopies + slash → faster fuel drying and higher wind penetration.
Homogeneous, even-aged stands → continuous, more flammable fuels.
Roads/WUI expansion → more human ignitions and faster fire spread.
What helps: prescribed/cultural burning, strategic thinning near communities, mixed-species/longer-rotation stands, maintained fuel breaks and defensible space.

Flood & Erosion Risk
Degradation alters soils and hydrology. Clearcuts, skid trails, and compacted harvest areas reduce infiltration and increase overland flow; roads and stream crossings add chronic sediment and can fail in intense storms. The result can be higher peak flows and erosion in small-to-mid watersheds, with the strongest effects in the first years after harvest and on steep or rain-on-snow terrain.
Takeaway: Degradation can increase flood peaks and sediment delivery, elevating risks to communities and infrastructure—management choices matter.
Post-harvest: higher storm runoff and peak flows; lower late-summer base flows.
Roads and crossings → major sediment sources; culverts can fail during extremes.
Steep slopes, erodible soils, and rain-on-snow events amplify impacts.
What helps: limit new road density; decommission or relocate high-risk roads; upsize culverts for extreme rainfall; retain riparian buffers; seed/mulch disturbed soils and re-vegetate quickly.

Source: Natural Resources Defense Council. Forest Degradation in Canada – R_25-04-A_05. April 2025.
Key Research
Research Papers (what the science says)
Matricardi et al., Science (2020) — Multi-decade satellite analysis shows logging + fire–driven degradation affected more forest area than deforestation in the Brazilian Amazon. PubMed
Lapola et al., Science (2023) — Estimates ~38% of remaining Amazon forest is degraded by fire, edges, logging and drought; degradation can cut dry-season evapotranspiration by up to 34% and emit up to 0.2 Pg C/yr, comparable to deforestation. Biblio UGent
Baccini et al., Science (2017) — Pan-tropical carbon accounting finds ~69% of gross above-ground carbon losses (2003–2014) came from degradation/disturbance, not outright clearing. PubMed
Haddad et al., Science Advances (2015) — Global mapping shows >70% of the world’s forests lie within 1 km of an edge, where human pressures and microclimate shifts degrade ecosystems. PMC
Qin et al., Nature Climate Change (2021) — Using annual biomass maps, authors show carbon loss from degradation exceeded that from deforestation in the Brazilian Amazon during the 2010s. arXiv
Policy & Investment Reports (what this means for decisions)
European Commission EUDR Portal (updated 2025) — Official overview of scope, timelines and phasing, and links to guidance and the Information System; clarifies deforestation- and degradation-free requirements and application dates. Environment
Climate Policy Initiative (2021) — Synthesis on forest degradation in the Brazilian Amazon and implications for policy and finance, useful for understanding macro-risk channels beyond deforestation counts. CPI
CDP Forests (2023) — Corporate disclosure and risk analysis across commodity supply chains; highlights hidden exposure to forest degradation in procurement and financing.
WRI: EUDR—What You Need to Know (2025) — Concise guide for companies and investors on operationalizing due diligence and interpreting degradation under the law. Guidance
FAO/UNEP assessments (2022–2023) — Global state-of-forests chapters on ecosystem health, fragmentation and degradation proxies, helpful for benchmarking regions where corporate assets are concentrated. FAOAssessment
World Bank (2023) “Hidden Forest Risks in Global Supply Chains” — Frames financial materiality (supply disruption, compliance costs, stranded assets) from both deforestation and degradation channels.
Why This Distinction Matters for Investors
Most investors are attentive to deforestation (land-use change) and miss degradation (quality/type change). That blind spot can hide material exposure in carbon, compliance, and operations.
Measurement Challenges
Deforestation is visible as canopy removal; degradation is subtler. Under the EU Deforestation Regulation (EUDR), degradation is defined as conversion of primary or naturally regenerating forest to plantation forest or other wooded land—a structural/type change that standard canopy-loss datasets may miss. Monitoring typically requires multiple proxies (connectivity/fragmentation, biomass change, disturbance alerts) plus high-resolution checks and geolocation.
More info at Global Forest Watch, White & Case
Risk Assessment
Degradation is easy to overlook yet material at scale. In the Brazilian Amazon, mapped degraded area has rivaled or exceeded deforested area in some years, and across the tropics most gross above-ground carbon losses (2003–2014) came from degradation/disturbance, not clear-cutting. For portfolios, that means risks to climate performance, supply reliability, and asset values even when “forest cover” appears intact.
Investment Strategy
Accounting for both deforestation and degradation enables complete due diligence. Wood and wood-derived products placed on the EU market must be degradation-free (and deforestation-free) after Dec 31, 2020, with plot geocoordinates and documented risk checks. For other commodities, degradation still drives hidden liabilities (e.g., carbon, water, fire risk) that affect suppliers and infrastructure.
More info at Green Forum, Global Forest Watch